Pilar is a a multidisciplinary product designer and experience crafter.
Onda
Menu
Onda: Data Portraits for Period Health
January-May 2018
Onda is a body-literacy toolkit that allows menstruating teenagers to chart and discover the patterns of their cycles by combining tactile and digital components.
Design a toolkit to help teenagers discover and appreciate both the beauty of their menstrual cycles and the importance of understanding them; to address period stigma by framing menstrual cycles as mirrors of a fascinating interior reality
Role
Research and User Interviews, Conceptualization and Design, Programming (Javascript in P5.js and Java in Processing), Prototyping & Illustration
The working prototype documented here has two main parts: a physical interface and a digital interface.
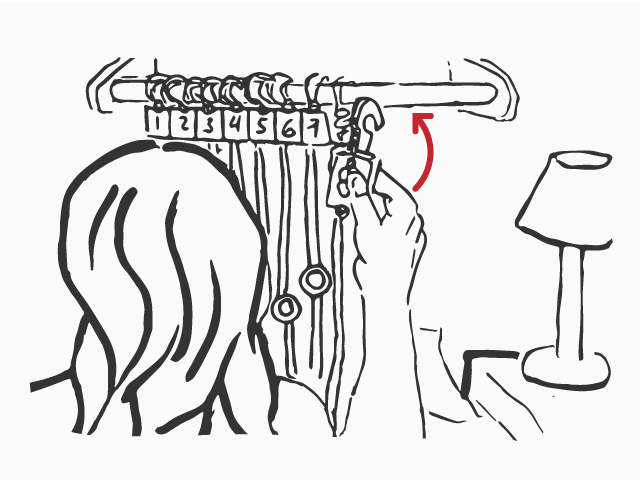
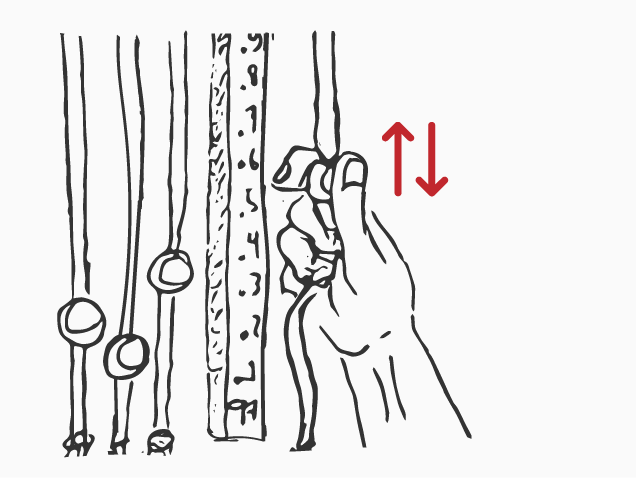
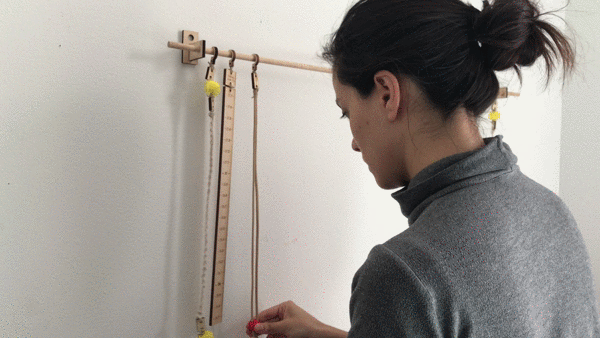
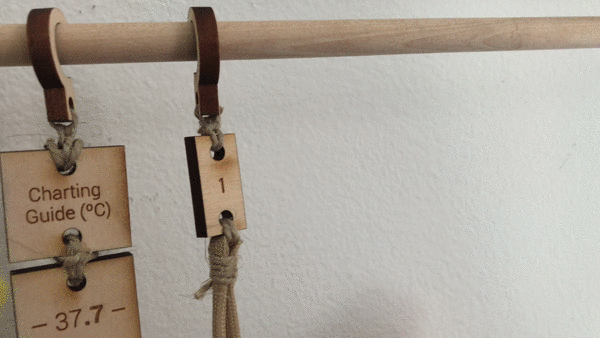
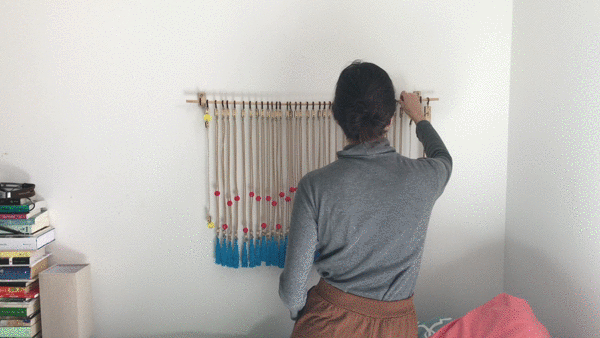
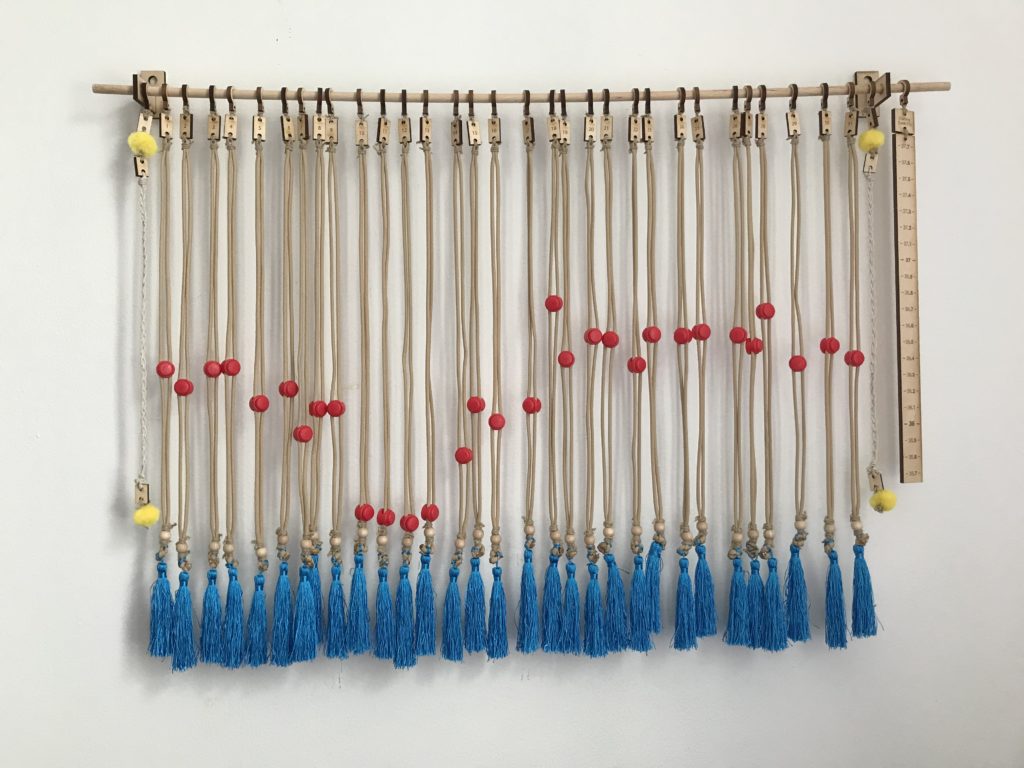
The tangible interface is a counter that resembles an abacus. Its sliding red beads allow the recording of users’ daily basal body temperature (BBT) within a range of 97–99 degrees Fahrenheit, including decimal points (More on why I chose this indicator in the “Further Reading” section).
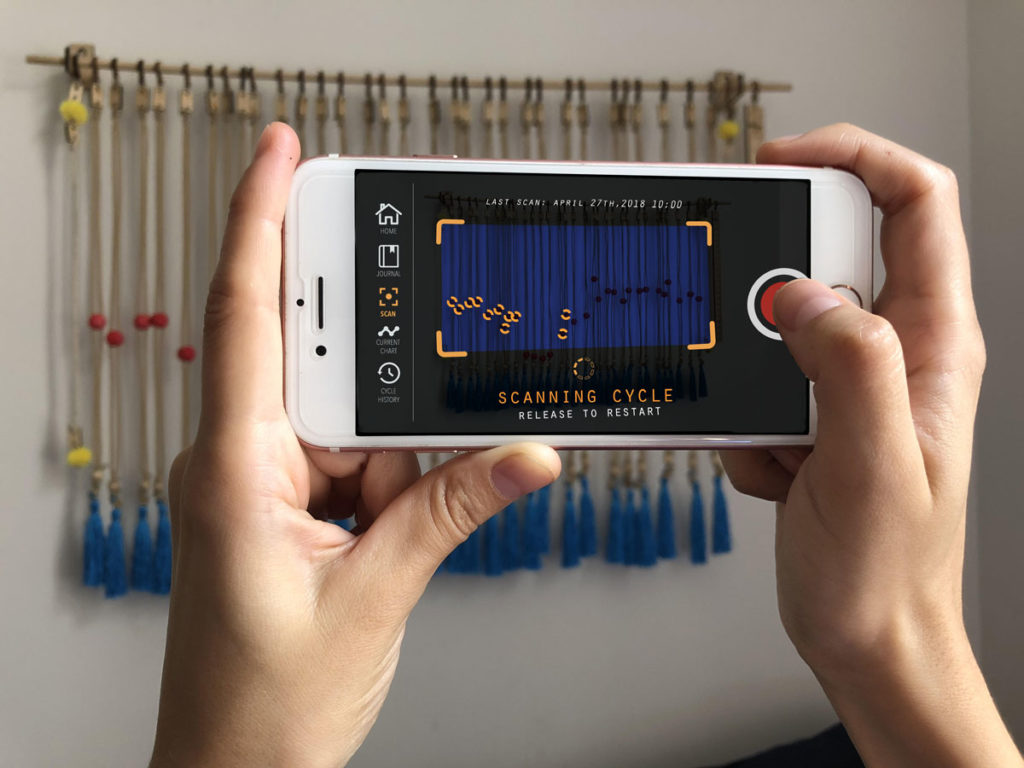
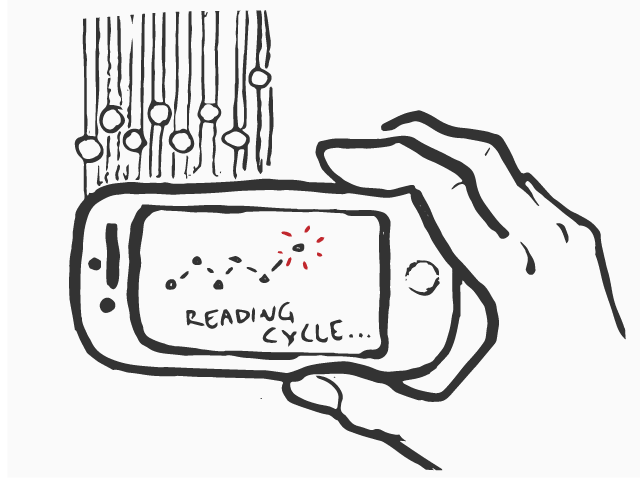
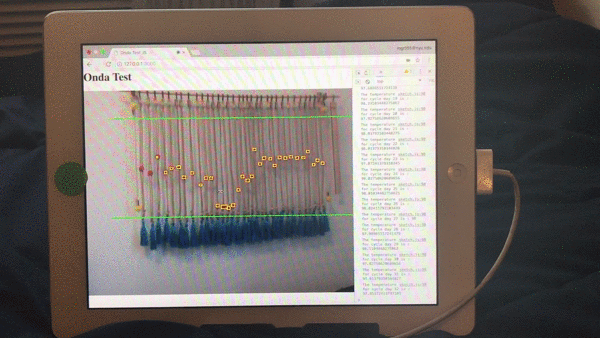
A mobile companion app will enable users to scan the counter and parse these images via a computer vision algorithm which detects each red bead (representing a temperature reading in a given cycle day) and saves it as a data point within the current cycle.
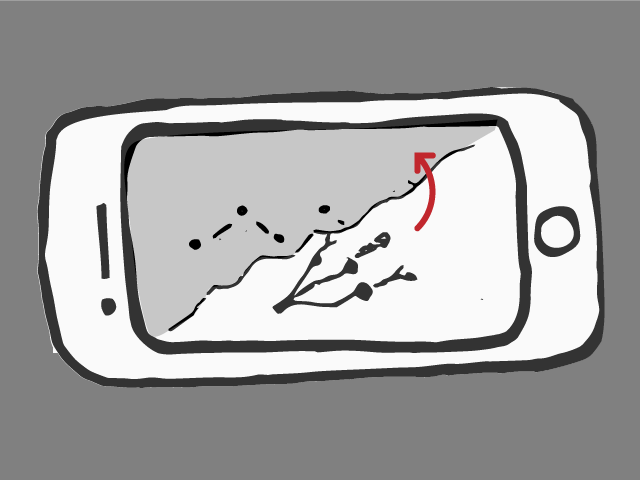
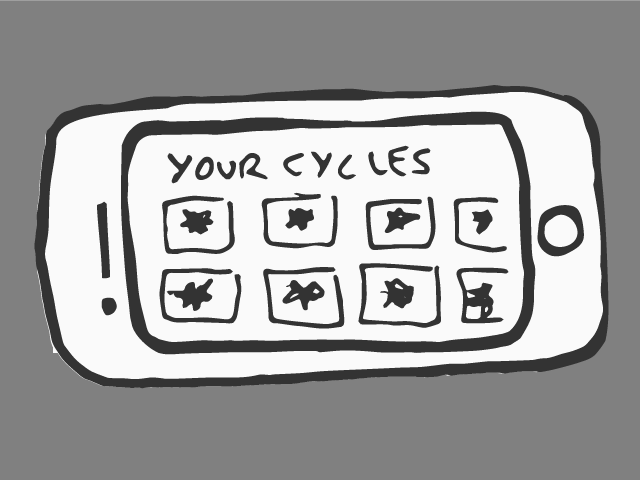
The app also generates an alternative circular data visualization of a cycle day by day. Users may also input other period-related phenomena (mood swings etc.,) that may reveal unique patterns. Finally, the app creates an archive—a data diary—of users’ information to track privately or share.
Special thanks to
The girls that charted their temps for a month and the ones I interviewed; Nancy Hechinger (thesis advisor) and Davíd Lockard and Michelle Hessel (reearch residents);Peter Longofono and sejo-vega cebrián,
USER JOURNEY
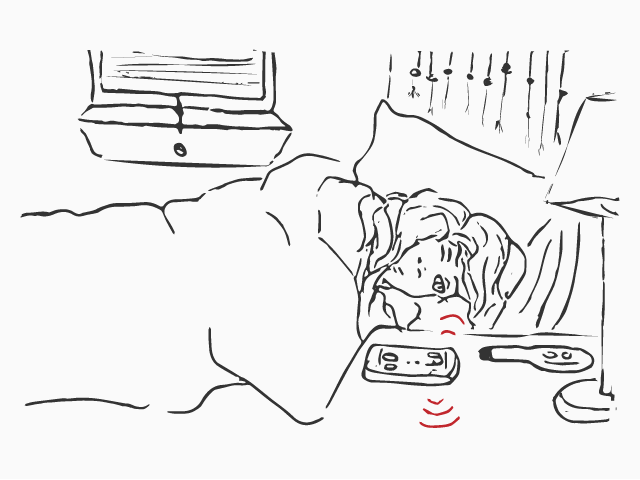
The user’s alarm rings.
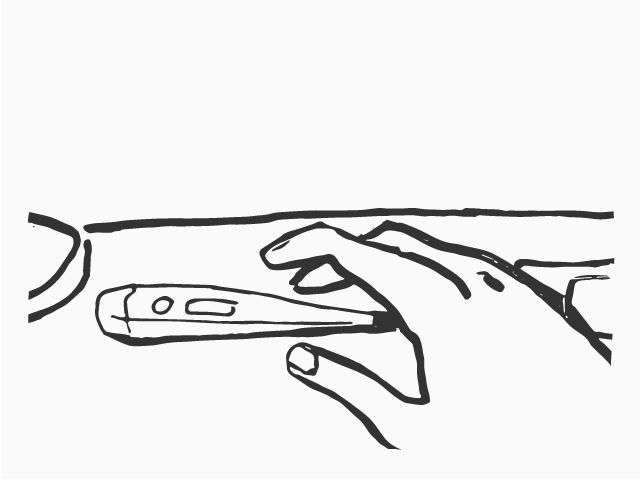
Using a digital thermometer...
She takes her basal body temperature putting the thermometer under her mouth
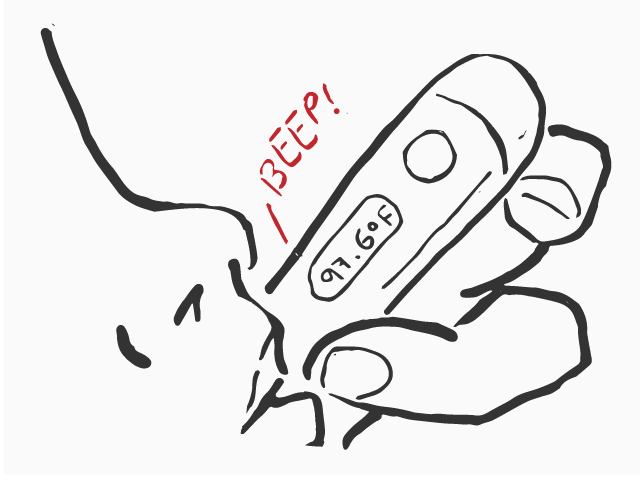
This takes about a minute...
Then the user records her temperatures
on the Onda Wall Calendar.
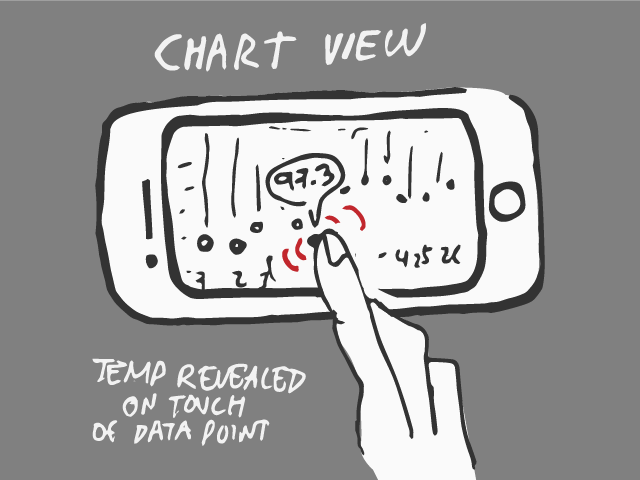
When pointing at camera phone, data points are read by an app.
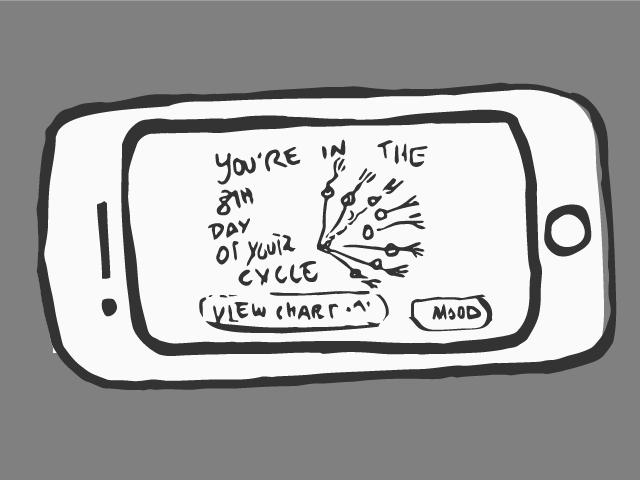
Initial data transforms (is animated) into a creature like form that reflect data as a cycle.
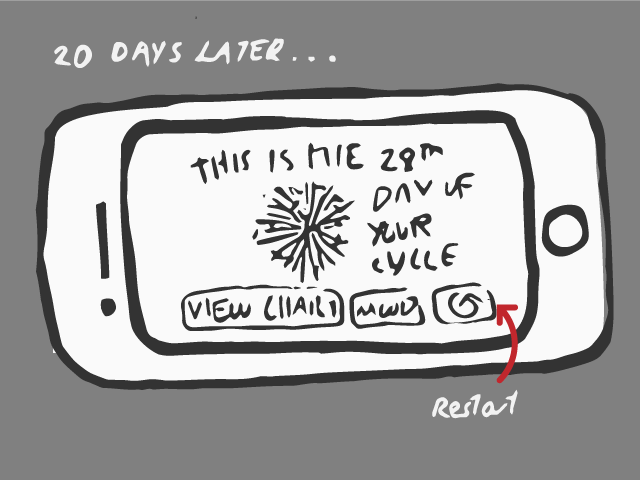
On the screen the user sees her current cycle day and has options-to add moods and start-a new cycle at any time
The user can shuffle between little creature and chart views
When user gets her-next period she presses the ‘restart’ button on app and removes the pieces from the abacus to start again.
And the user may browse through her cycle archive at any time
CYCLE DATA PORTRAITS
I explored different visualizations using my own temperature readings–taken from Dec. 29–Apr. 27. In mature cycles with an ovulatory interlude, there is a consistent number of low temperatures before ovulation preceded by a consisten number of high temperatures after ovulation.
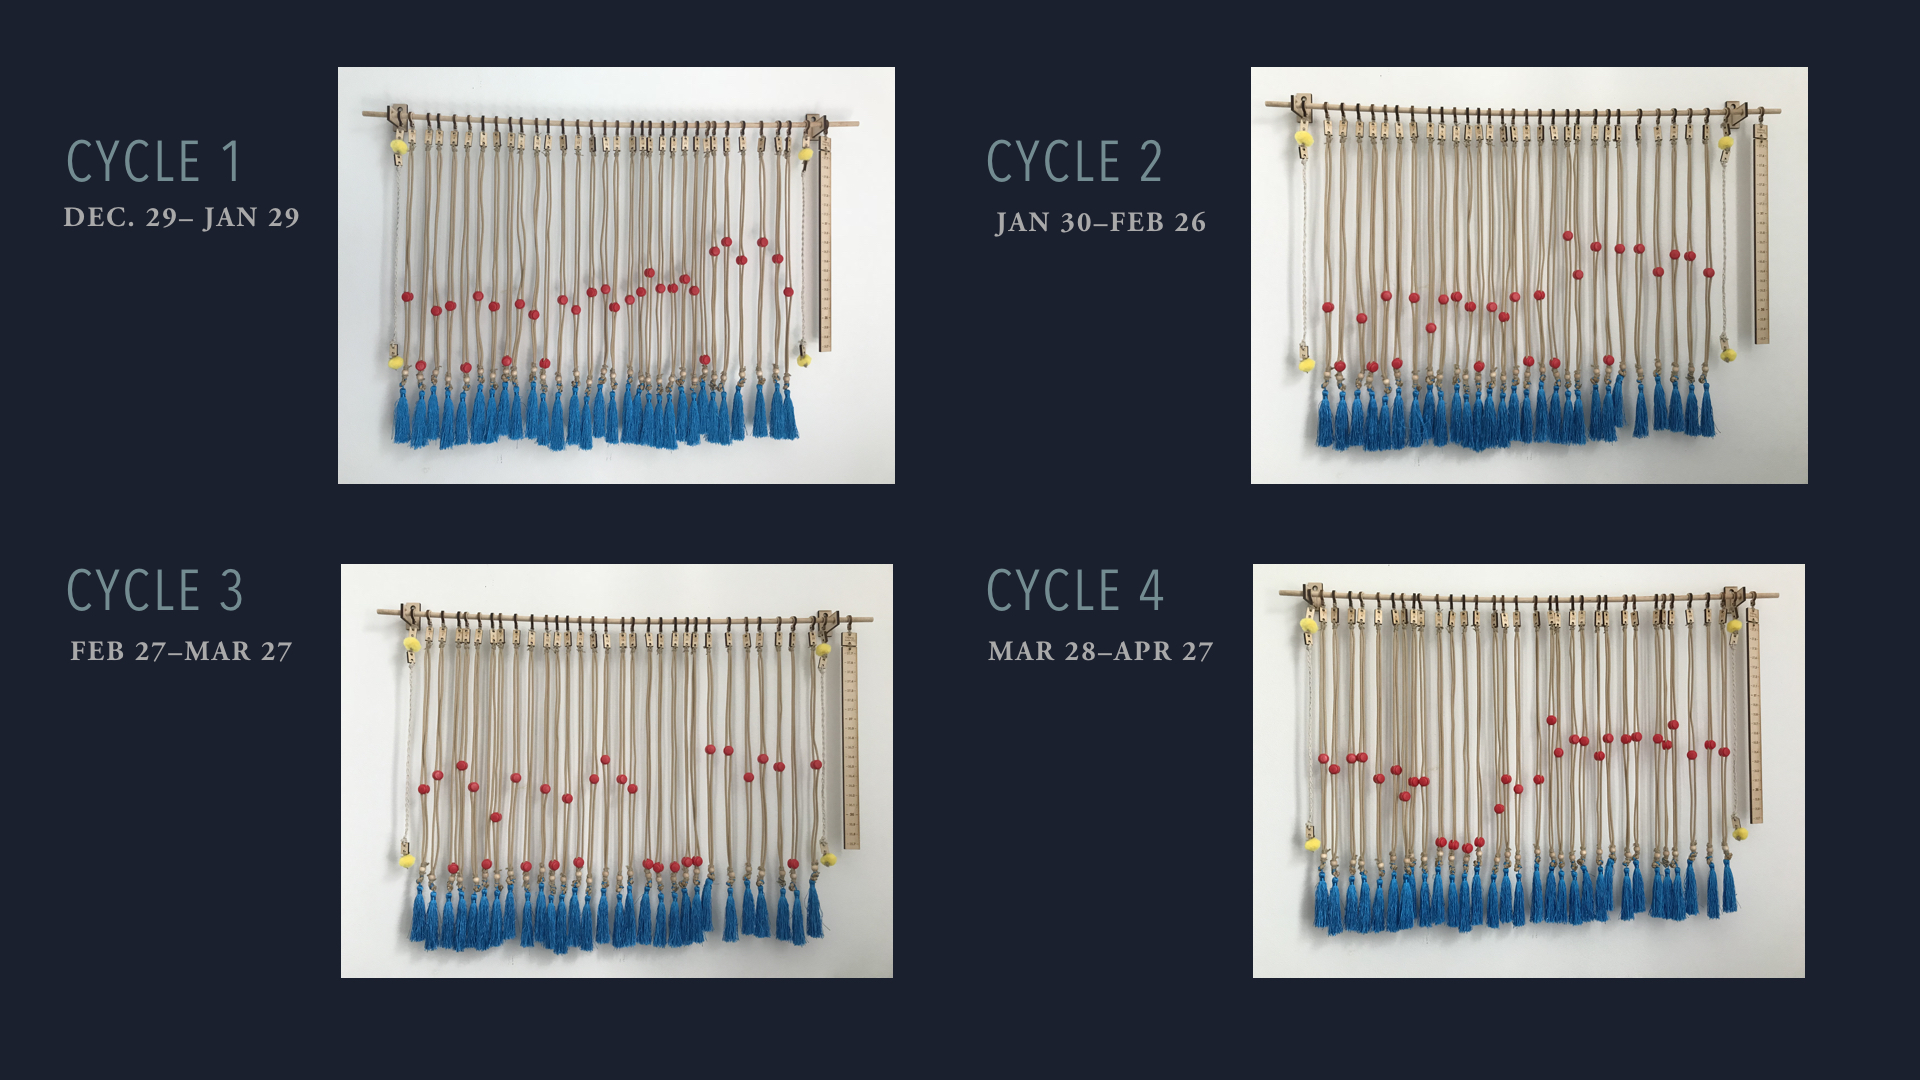
Cycles charted linearly on the Onda Wall Calendar
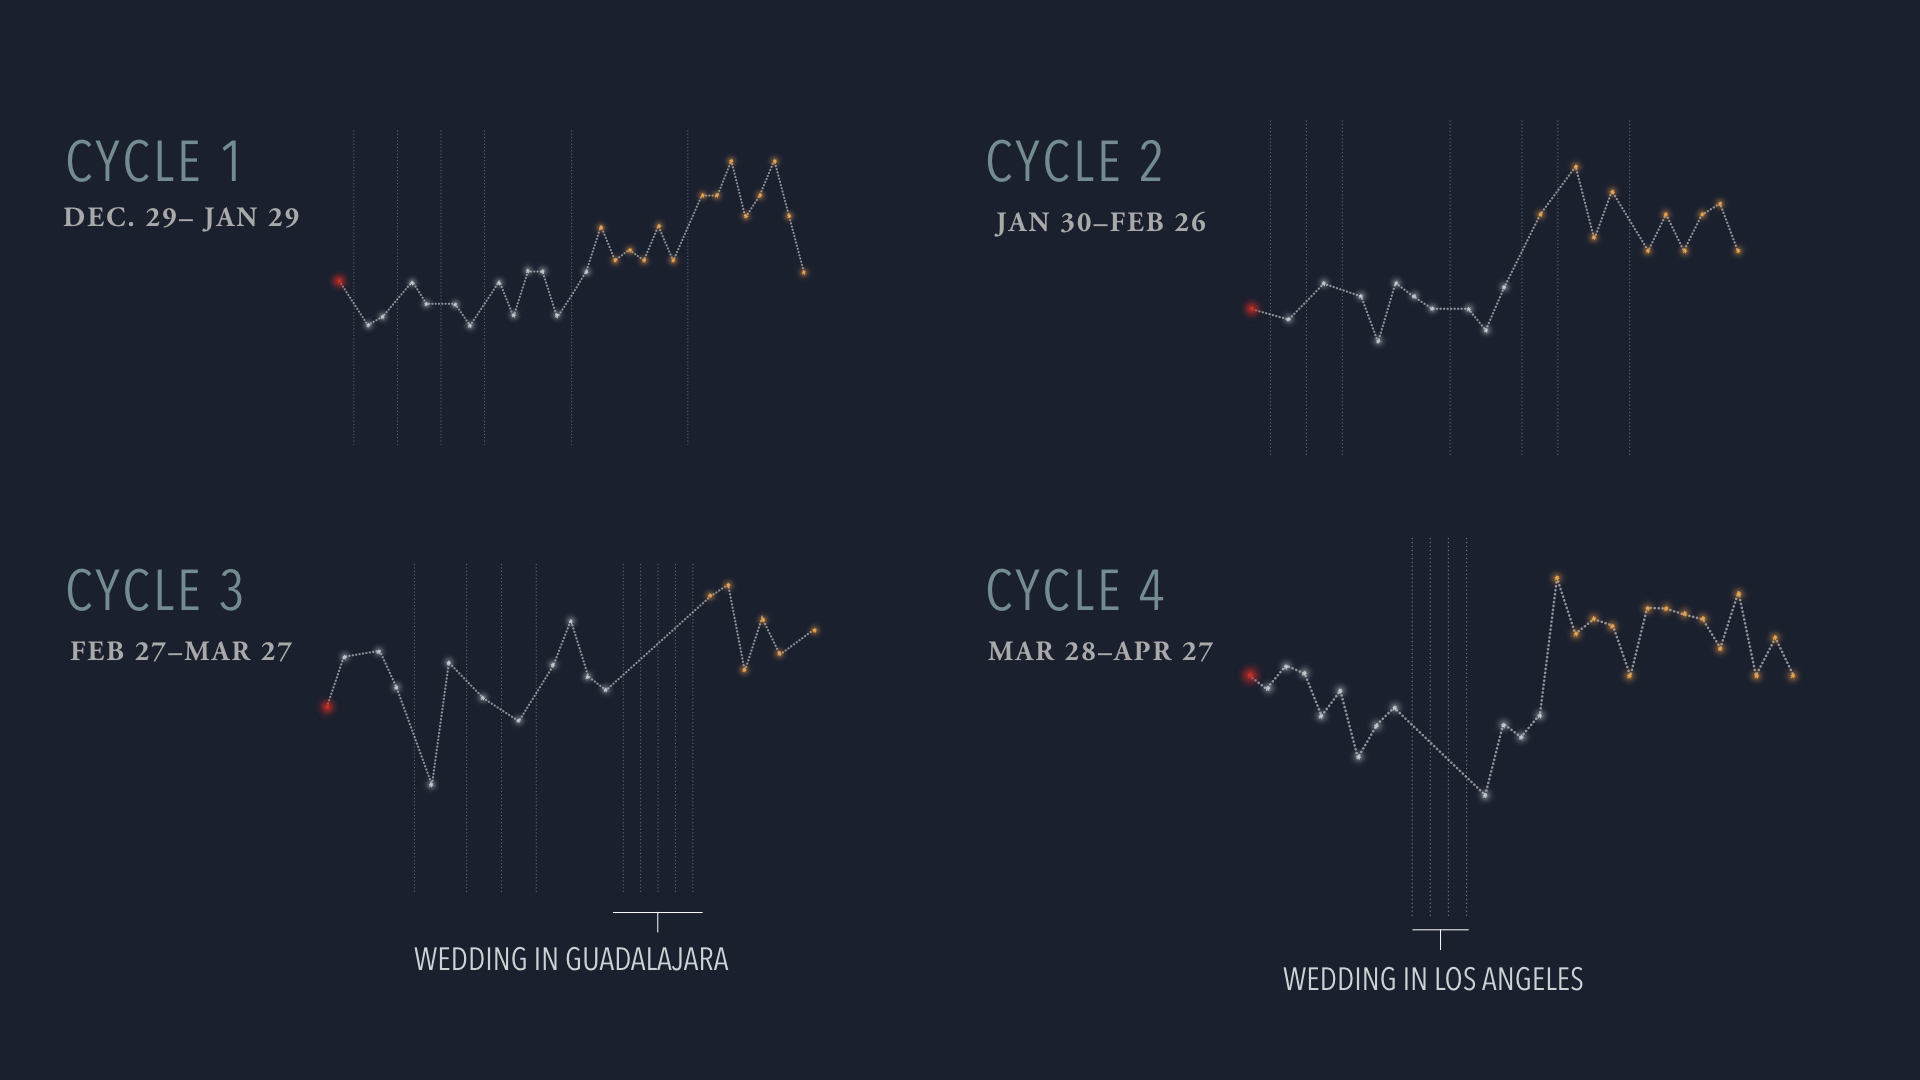
Another linear visualization, red marks the first day of heavy bleeding, blue the low temps stage (also called follicular stage), orange the high-temps stage (also called the luteal fase. Vertical lines indicate days of missed readings
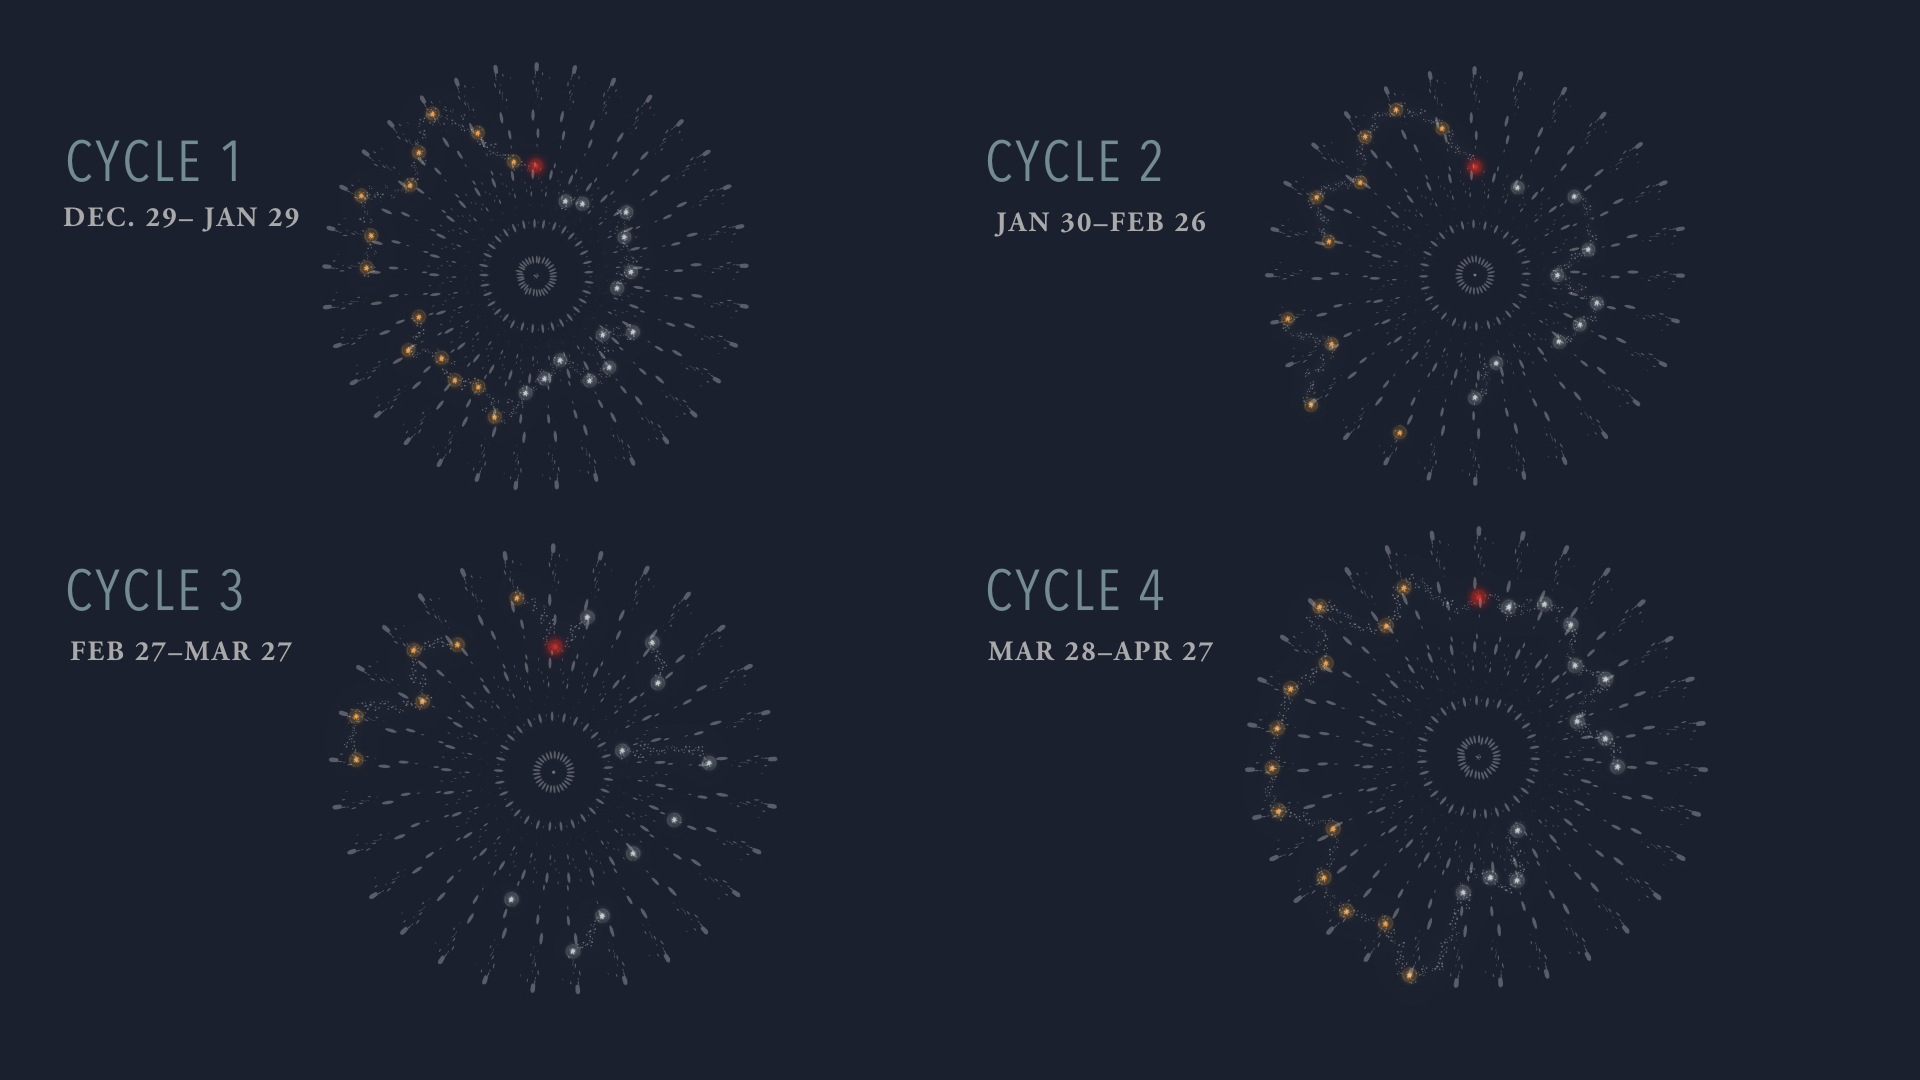
The cycles plotted in a polar graph, to emphasize their cyclical nature
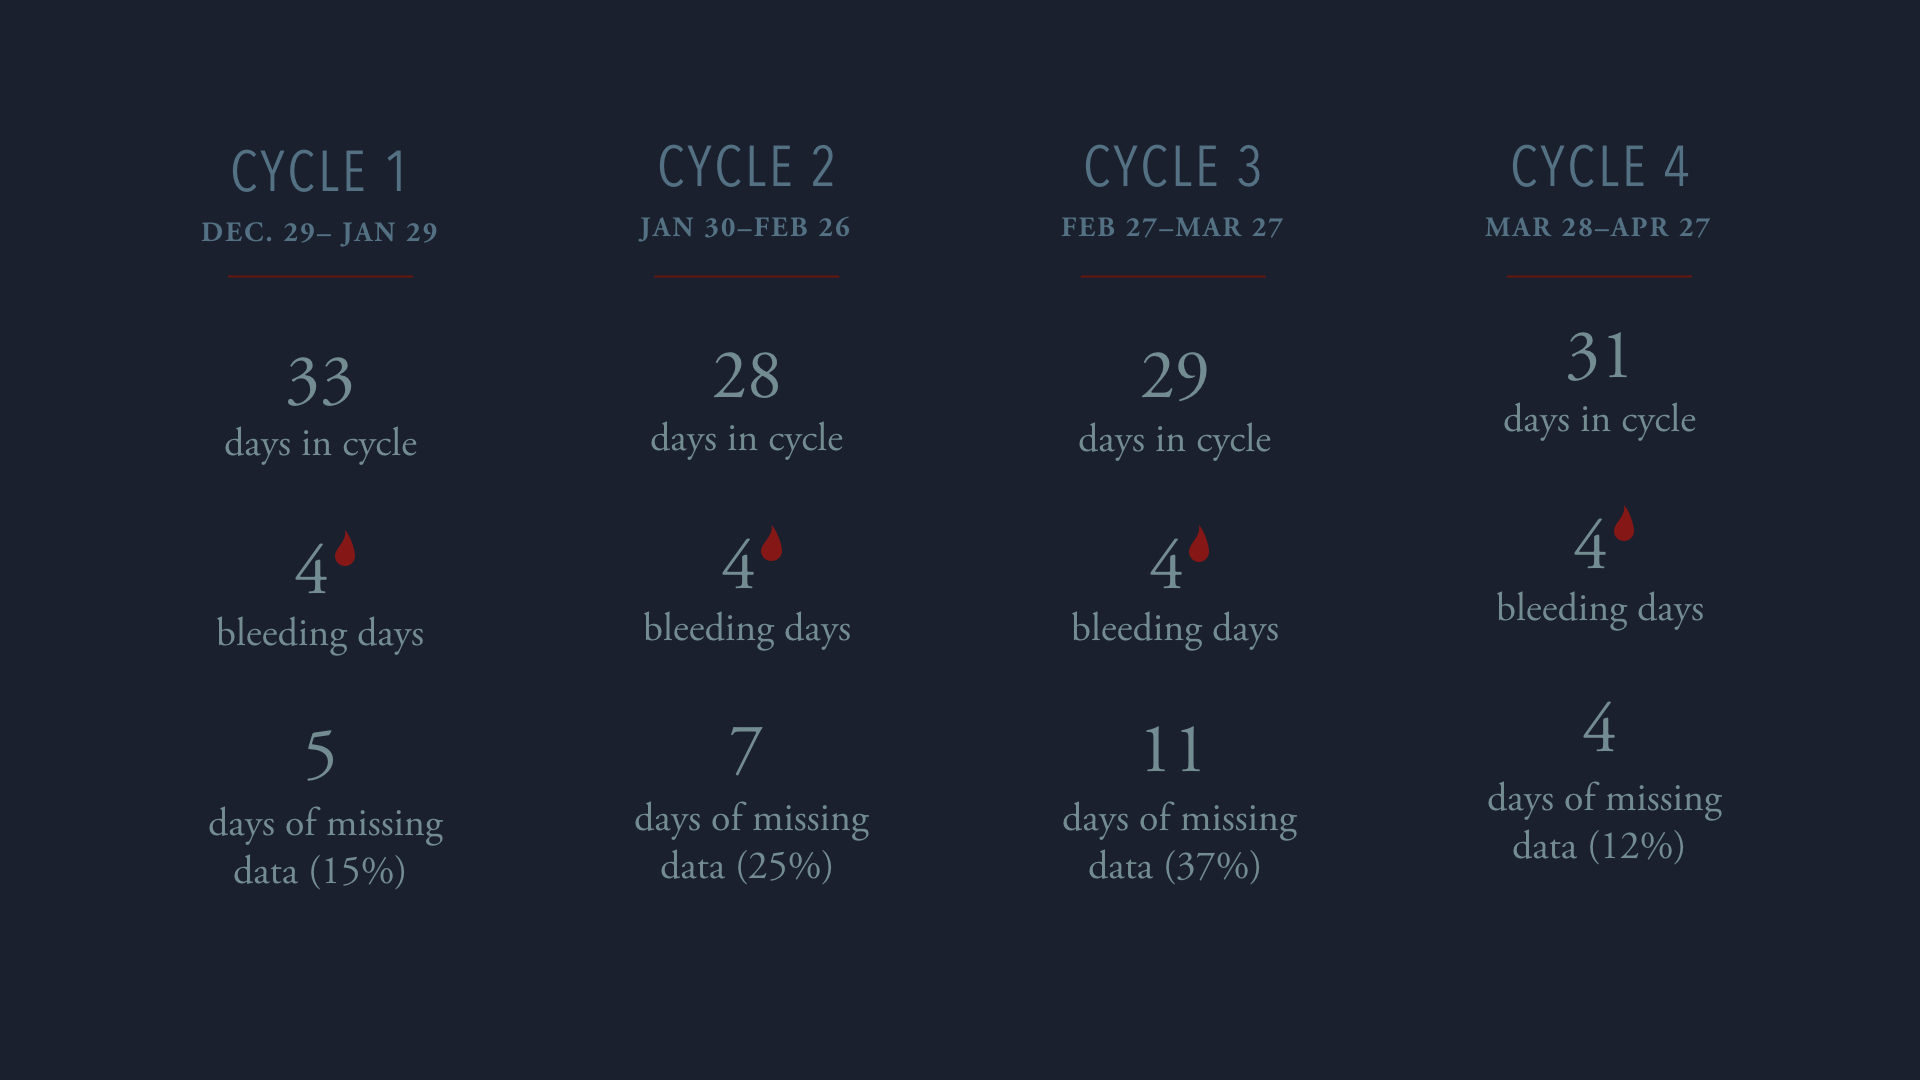
Some stats of the four cycles
DETAILS OF PHYSICAL INTERFACE
SNAPSHOTS OF DIGITAL PROOF OF CONCEPT
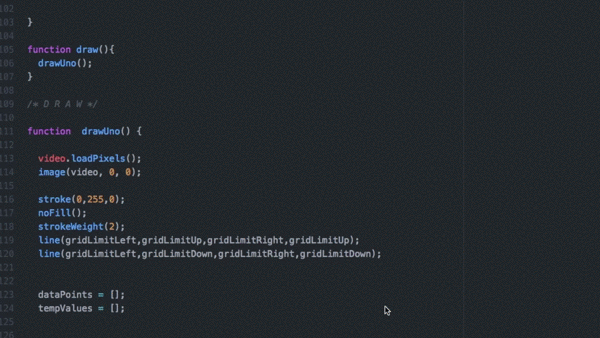
Code Snippet
Viewing P5.js sketch on a desktop browser
WANT TO SEE MORE OF MY WORK?
Return to the Case Studies Dashboard (my Homepage) by clicking on the button